- Published on
What is a regular time series?
- Authors
- Name
- Nicholas Junge
I wrote my thesis on time series analysis last year at the Technical University of Munich (TUM), and I am really happy with the direction that it took.
First of all, it was a data science project - with real data, a real use case, and even live updates!
Secondly, it was comprised of multiple diverse subprojects, each of which I want to present in this post and its follow-ups.
And lastly, it used classical methods, so no neural networks anywhere. I liked this approach because it opens up a much clearer and more direct connection to the mathematical discipline of time series analysis.
So without further ado, let us jump into the first task: Detecting regularity in a time series. This is one of those cases where the problem is simple, but not easy. Surely all of us have an idea of what regular means, but how do you take that and translate it into mathematics (and, ultimately, numbers)?
The first attempt: Probability Theory 101
Consider these two series of ten coin flips (heads and tails):
H T H T H T H T H T vs. H H T T T H T H H T
Clearly, the first one is regular in the sense that it is predictable - tails follows heads - while the second one is not (at least not at first glance). And yet, both of these coin flip sequences have the same mean and variance (their MLE is a fair coin), since heads and tails come up five times each. So classical moment-based statistics cannot be the answer (which make sense, since they are essentially sums, and these do not care about order anyway).
Second attempt: Counting words
So what about counting H T as a single "word" in the above sequence? Then we would end up with a completely determined sequence in the first example (the time series consists only of the word H T, repeated forever) and... something else for the second. An information measure like Shannon Entropy could then tell us what the expected information gain is in each new word; the lower the entropy, the more regular it is.
Nice idea - this is essentially the concept behind Approximate Entropy or ApEn, a regularity measure invented in the 1990s to study regularity in heart rate time series of newborns. In this specific case of binary time series, one can show that in the limit of an infinite number of observations, ApEn is equal to the Shannon entropy of the first order Markov chain associated to our coin flip.
When studying this algorithm, you end up with a couple of unfortunate properties, though. First of all, the word template counting is inherently where is the number of observations, since each template needs to be matched to any other. And then, what length should the template be? Does like above work better than for your dataset?
The bad scaling and the hyperparameter dependence are really not ideal when dealing with hundreds of thousands of individual time series like I was. I did in fact include these approaches, and they revealed interesting qualitative aspects on my data. But for producing reliable numbers at scale, clearly there has to be something more sound than this.
Third attempt: Riding the waves
Turns out there is. TLDR: It's the Fast Fourier Transform.
But why? Sine and cosine waves are usually not your first connection when thinking about coin flip sequences.
Well...
The magic word in this situation is predictable. To be predictable means to be entirely determinable using the knowledge of past events. And that makes sense when you think about it a little more: In the first example, we can entirely determine the next coin flip as the opposite of what the last one was.
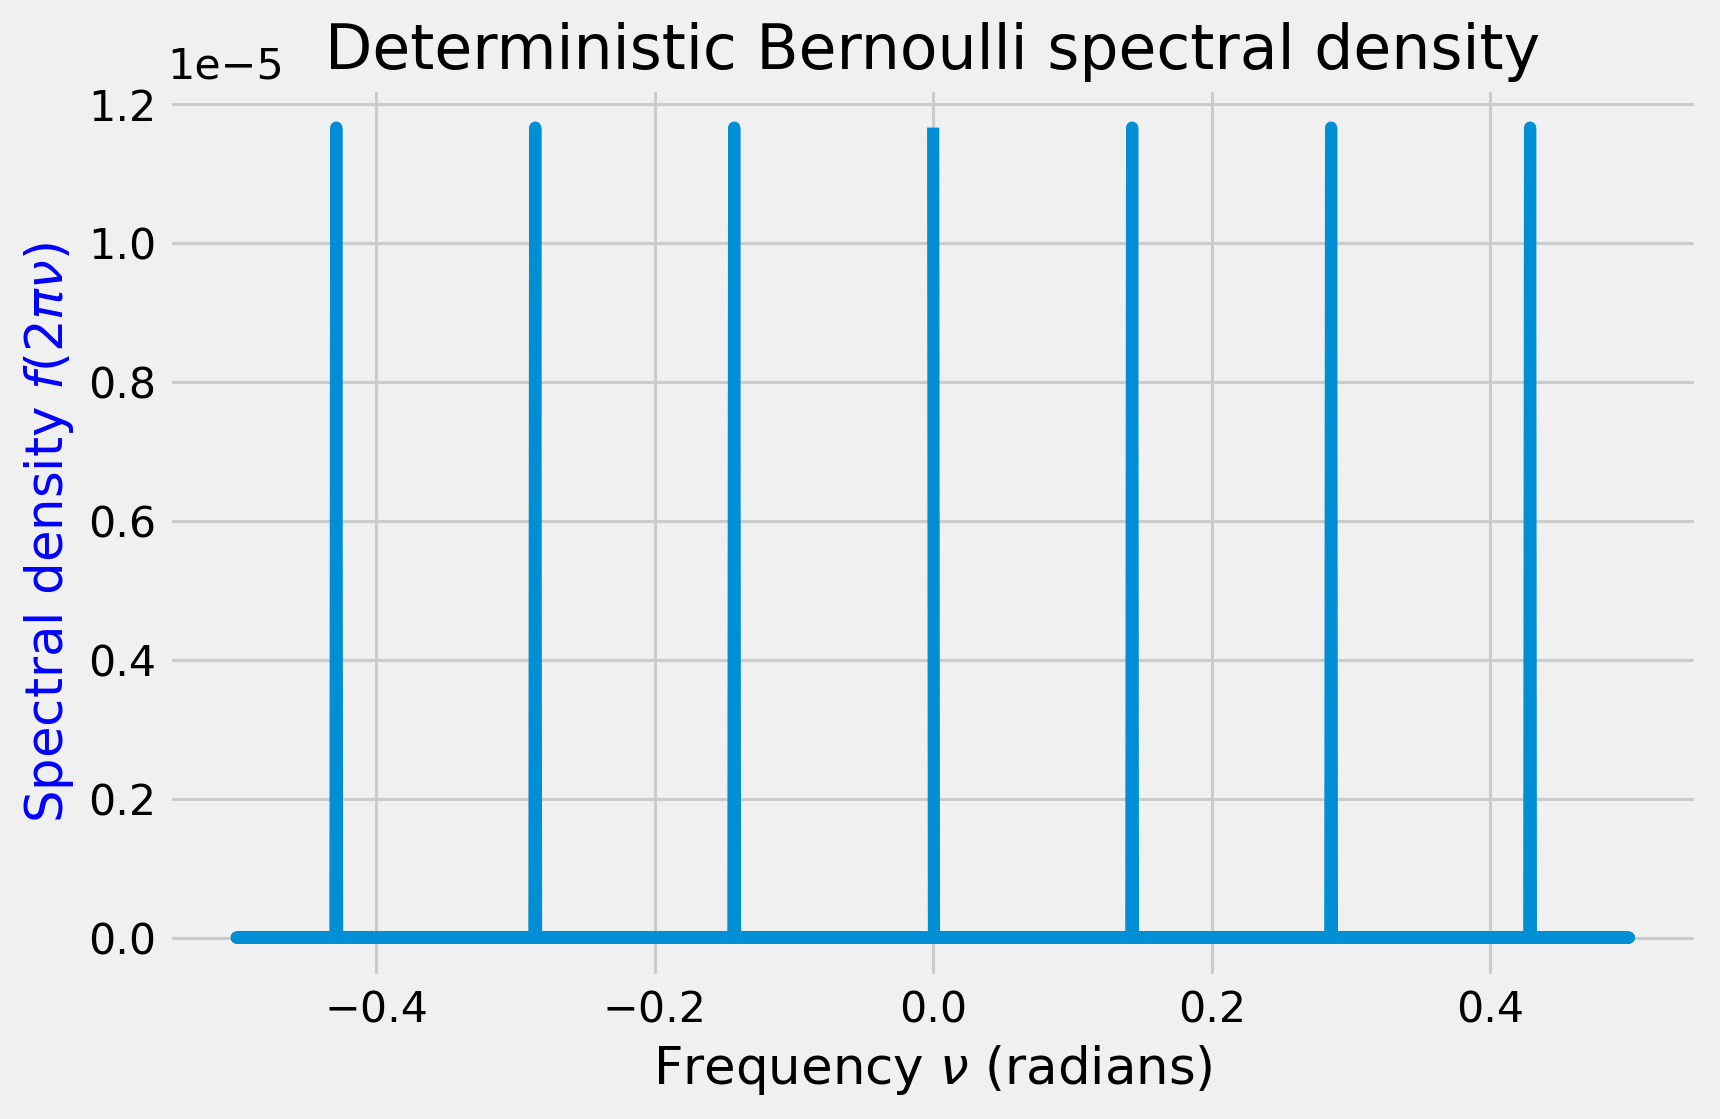
In the Fourier analogy, the coin behaves like a single wave with period 2, since heads follows tails follows heads. Therefore, in a periodogram, which carries the frequency information of the time series, the regular coin flip will appear as a small number of distinct spikes.

And the other one? We can reason about that, too. Since it is random, the time between heads is random, and thus the frequency of heads must also be random. No frequency is privileged, so the frequency distribution (also called spectral density) should appear approximately uniform. This is the defining characteristic of a white noise time series.
And the best part: If you compute the Shannon entropy of both of these, the two cases constitute the two opposing ends of the spectrum (no pun intended) of values - the entropy of a spiky distribution is low, and that of a uniform distribution is maximal per definition. And the FFT is , too. Perfect!
Is that all?
Unfortunately, not quite. There are multiple problems that I omitted here, but that need to be worked out first:
- What even is the Fourier Transform of a time series supposed to be? How would you define the Fourier Transform of a stochastic process?
- The periodogram is bad as a spectral density estimator - it does not even converge pointwise to the expected value of the spectral density. You need to first "repair" it by using smoothing methods.
- Binary events need to be binned and resampled - depending on the binning frequency, you end up with more or fewer zeros, which also influences your signal.
This concludes my first post on my thesis. More is still to come, with more in-depth mathematical introductions to some elements in the write-up above. See you for the next one!